
Translated from the original post in Spanish.
TuTi is a discount supermarket chain that has operated in Ecuador since early 2020. It belongs to the El Rosado corporation, which also owns other supermarket chains within its conglomerate: HiperMarket, Mi Comisariato, and Mini.
This chain in particular has become famous not only for its rapid expansion but also for its aggressive strategy1. With more than 800 stores nationwide in 2026, TuTi is characterized by leasing small and medium-sized commercial spaces. According to some experts, this strategy has driven the disappearance of neighborhood corner stores (“tiendas de barrio”).
But are all these stores mapped? Where are they located, and how have they affected neighborhood stores?
Here, we analyze three data sources that can reflect this phenomenon: OpenStreetMap, Overture Maps, and TuTi’s official website.
TuTi’s strategy#
According to some experts23, the strategy that has allowed TuTi to grow extraordinarily fast focuses on selling large volumes at low prices. This is made possible by several practices, such as the size of its stores, the brands of the products it offers, and cash-only payments, among others.
From a spatial perspective, this strategy rests on the following pillars:
- Leasing small stores without additional services such as parking.
- Proximity to areas with higher population density.
- Not selling fresh produce such as fruits and vegetables.
- A limited offering of private-label products.
The first two are the most significant in spatial terms. First, leasing commercial spaces creates a pricing dynamic in neighborhoods and city areas where such a large corporate player did not previously exist. This can, in turn, affect commercial rental prices. Second, the supermarkets’ own location strategy — much closer to where mass demand is concentrated, unlike large supermarkets — directly affects neighborhood stores45. Back in 2023, Gabriela Coba of Primicias published an interesting analysis of TuTi’s strategy and the presence of other supermarket chains in Ecuador6.
To analyze the impact TuTi has on neighborhood stores and the local economy, it is necessary to have data with disaggregated store locations — that is, not just the total number of stores at the provincial or cantonal level, but their specific coordinates or addresses.
Below, I analyze the availability of this information in three sources: OpenStreetMap, Overture Maps, and TuTi’s website.
TuTi on OpenStreetMap#
OpenStreetMap is a worldwide collaborative map that offers open, free-to-use data. The data is added and updated by its community of users. OSM data can be accessed directly from its website, where it can be queried on a Google Maps-style interactive map. Other tools exist for running more complex queries. Overpass Turbo is one of them. It lets you query the database efficiently and download or use the data in different formats.
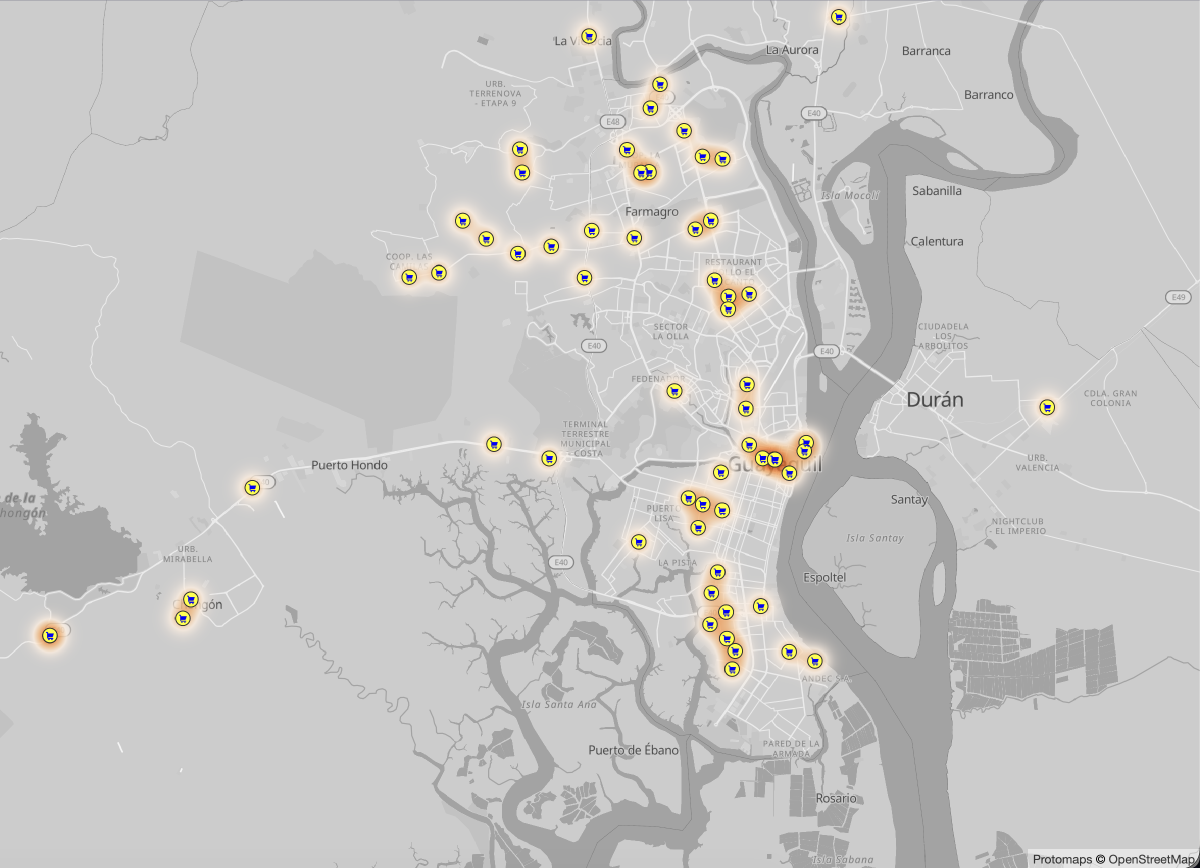
For example, in Overpass Turbo you can use a query like this one to get all the supermarkets in Ecuador named TuTi.
[out:json][timeout:300];
area["ISO3166-1"="EC"][admin_level=2]->.ec;
nwr[shop=supermarket]["name"~"^tuti",i](area.ec);
out center;| Province | Number of TuTi stores |
|---|---|
| Guayas | 57 |
| Pichincha | 25 |
| Manabí | 12 |
| Azuay | 6 |
| Carchi | 5 |
| Cotopaxi | 2 |
| Los Ríos | 4 |
| Imbabura | 3 |
| Bolívar | 2 |
| Tungurahua | 2 |
| Chimborazo | 2 |
| Napo | 1 |
| Total | 121 |
TuTi on Overture Maps#
Overture Maps, on the other hand, is an open-data initiative involving data giants such as Meta, Microsoft, Amazon, and TomTom. The idea is to share a data ecosystem that, instead of creating competition among them, unifies their efforts into one. Overture Maps aggregates, cleans, and standardizes data from various sources (including OSM). The most interesting part is that the data is freely accessible. They offer a web explorer from which data can be queried and downloaded, but it can also be done programmatically.
For this case, a Python script was created to query and download data on supermarkets named TuTi in Ecuador, using packages such as DuckDB, GeoPandas, and Shapely.
Surprisingly, fewer results were obtained from Overture Maps than from OSM.
| Province | Number of TuTi stores |
|---|---|
| Guayas | 34 |
| Pichincha | 4 |
| Manabí | 7 |
| Carchi | 5 |
| Imbabura | 2 |
| Azuay | 1 |
| El Oro | 1 |
| Napo | 1 |
| Total | 55 |
TuTi on its official website#
Finally, there is the option of extracting data directly from TuTi’s website using a web-scraping script. We ran two extraction passes on TuTi’s website, one in April 2025 and one in April 2026. As shown in the table, the number of stores rose from 654 to 808 — an increase of more than 23% in a single year. TuTi now has a presence in 18 of Ecuador’s 24 provinces. Guayas and Pichincha remain the provinces with the highest concentration.
| Province | Number of TuTi stores (April 2025) | Number of TuTi stores (2026) |
|---|---|---|
| Guayas | 227 | 273 |
| Pichincha | 160 | 193 |
| Manabí | 73 | 83 |
| Azuay | 4 | 22 |
| Carchi | 1 | 2 |
| Cotopaxi | 7 | 13 |
| Los Ríos | 31 | 36 |
| Imbabura | 22 | 25 |
| Bolívar | 6 | 7 |
| Tungurahua | 21 | 32 |
| Chimborazo | 21 | 27 |
| Napo | 3 | 5 |
| Cañar | 3 | 4 |
| EL Oro | 33 | 31 |
| Esmeraldas | 4 | 5 |
| Pastaza | 1 | 4 |
| Santa Elena | 21 | 23 |
| Santo Domingo | 16 | 23 |
| Total | 654 | 808 |
Summary table#
| Province | OSM | Overture Maps | Website 2025 | Website 2026 |
|---|---|---|---|---|
| Guayas | 57 | 34 | 227 | 273 |
| Pichincha | 25 | 4 | 160 | 193 |
| Manabí | 12 | 7 | 73 | 83 |
| Los Ríos | 4 | 0 | 31 | 36 |
| Tungurahua | 2 | 0 | 21 | 32 |
| El Oro | 0 | 1 | 33 | 31 |
| Chimborazo | 2 | 0 | 21 | 27 |
| Imbabura | 3 | 2 | 22 | 25 |
| Santa Elena | 0 | 0 | 21 | 23 |
| Santo Domingo | 0 | 0 | 16 | 23 |
| Azuay | 6 | 1 | 4 | 22 |
| Cotopaxi | 2 | 0 | 7 | 13 |
| Napo | 1 | 1 | 3 | 5 |
| Esmeraldas | 0 | 0 | 4 | 5 |
| Pastaza | 0 | 0 | 1 | 4 |
| Cañar | 0 | 0 | 3 | 4 |
| Bolívar | 2 | 0 | 6 | 7 |
| Carchi | 5 | 5 | 1 | 2 |
| Total | 121 | 55 | 654 | 808 |
Although the data extracted from TuTi’s website far exceeds that of the other platforms, it contains some inconsistencies, especially in the geographic coordinates. This suggests that TuTi probably has no verification or quality-control process for the data it stores about its own stores. Some points had to be manually relocated using the address as a reference.
In any case, with the data obtained, a more detailed analysis of store distribution in each city and its possible impact on neighborhood stores and the local economy can be carried out. In an upcoming post, I will share some thoughts on this type of analysis.
Preliminary conclusions#
As a conclusion, the most reliable and complete data source for this type of analysis is the company’s own website. Despite TuTi’s popularity in Ecuador, it appears that users have not added the full set of stores to the OSM platform.
The company’s data has some inconsistencies, especially in the stored geographic coordinates. With the data obtained, we have been able to create some tools and results that will be useful for a deeper analysis.
References#
Ayala Sarmiento, S. (2025, Diciembre 29). TuTi roza las 800 tiendas tras siete años de su creación en ecuador y de una expansión agresiva. Primicias. ↩︎
Almeida, C. (2025, October 22). El discounter en Ecuador: La Nueva fuerza que está reconfigurando el retail. Kantar. Shape your brand future. ↩︎
Vivar Espinosa, E. (2025, March 17). El Fenómeno Tuti: ¿Cuál es su estrategia?. Forbes Ecuador. ↩︎
Hualca, A. (2025, Mayo 19). Tuti quiebra a las tiendas de barrio. La Naranja Ec. ↩︎
Ayala, S. (2025, February 17). La inseguridad y Tuti Ponen en Terapia intensiva a las tiendas de barrio. Primicias. ↩︎
Coba, G. (2023, Septiembre 16). El Formato de Tuti desata una guerra de precios y promociones. Primicias. ↩︎